Choosing the 2026 best solar electricity system requires more than comparing panel wattage or glossy savings estimates. A reliable system must match the home, climate, budget, and daily electricity pattern. A south-facing roof may capture strong sunlight, while nearby trees can create afternoon shadows. Battery storage also matters when evening demand rises after the panels stop producing.
The strongest options will likely combine efficient panels, a dependable inverter, practical monitoring, and a battery sized for real household use. Buyers should examine degradation rates, product warranties, installer certifications, maintenance terms, and expected output in cloudy months. Independent performance data is more useful than a dramatic sales promise. Ask for a site assessment, not a template quotation.
Every home is different.
A system that performs well in Arizona may disappoint in a shaded British garden. Local utility rules, roof age, extreme weather, and electricity tariffs can change the financial result. Even careful forecasts contain uncertainty, especially when future energy prices remain unpredictable. This guide compares the features that matter most in 2026 and explains where buyers may need to compromise. The “best” system is not always the largest or most expensive. Sometimes, a smaller installation with a trusted installer, clear warranty support, and sensible battery capacity offers greater long-term confidence. We may still overlook something. That is why measured production data and honest after-sales service deserve close attention.

The 2026 solar market starts with unusually strong demand. IRENA’s Renewable Capacity Statistics 2025 reports 451.9 gigawatts of new solar capacity added globally in 2024. Total installed solar capacity reached about 1,865 gigawatts. These figures show scale, but they do not identify the best system for every buyer.
The IEA’s Renewables 2024 report expects global renewable capacity to grow by 5,500 gigawatts between 2024 and 2030. Solar photovoltaics and wind should provide about 95% of that expansion. For buyers, this supports a practical system choice: efficient panels, a correctly sized inverter, and optional battery storage. A south-facing roof may produce strong daytime output, while a shaded roof can change the economics sharply.
System demand also depends on local electricity prices, grid reliability, roof structure, and export rules. A household with stable daytime consumption may need little storage. An evening-heavy household may value a battery more. The “best” design is therefore measured in usable electricity, not panel count.
PV prices and installation costs remain difficult to compare across countries. IEA PVPS data also shows rapid deployment, but market averages can hide weaker workmanship. I would request production estimates based on local weather data, not optimistic brochures. My own baseline can still miss future tariffs, maintenance costs, or changing household demand. That uncertainty deserves a place in the buying decision.
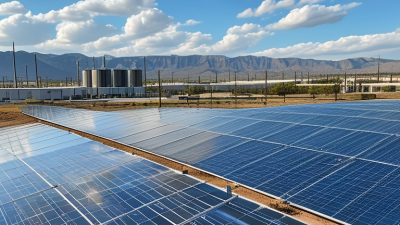
For 2026 buyers, the best solar electricity system is not automatically the largest one. It depends on grid reliability, roof space, daily demand, and backup expectations. A grid-tied system is usually the simplest choice. Solar panels supply daytime loads, while the utility covers shortfalls. Excess electricity may be exported under local rules. This design often costs less because it uses no battery. However, it normally shuts down during a grid outage. That behavior protects utility workers.
A hybrid system adds battery storage and intelligent controls. It can keep selected circuits running when the grid fails. Refrigerators, lights, internet equipment, and medical devices need careful load planning. Battery capacity is not the same as inverter power. A battery may store enough energy but still fail to start a large pump. Experienced installers review electricity bills, peak loads, shading, roof structure, and future electric-vehicle demand. They should explain warranty terms, maintenance access, and emergency shutdown procedures. Ask for calculations, not broad promises.
Off-grid architecture suits remote properties with weak or absent utility service. It needs more than panels and batteries. A generator, charge controls, and strict energy habits may be necessary during cloudy periods. Oversizing is common. So is wishful thinking. A common planning mistake is treating average consumption as a guarantee. Homes use power unevenly, especially during heat waves. Seasonal sunlight and outage scenarios deserve real testing. A summer spreadsheet cannot represent a winter outage.
Choosing the best solar electricity system in 2026 starts with accurate sizing, not the largest array. I begin with twelve months of electricity bills and note seasonal changes. NREL PVWatts can estimate production from system size, roof tilt, azimuth, and location. Entering a nearby weather station is useful, but local terrain can alter sunlight. A hill, tall tree, or chimney shadow may reduce output sharply. Measure twice.
I compare the PVWatts result with local solar-resource data, including monthly irradiance and typical cloud patterns. Then I test several capacities, such as 4, 6, and 8 kilowatts. The goal is not maximum annual generation. It is a practical match for household demand, roof space, budget, and future loads. A heat pump or electric vehicle can change the calculation. I also include system losses, high summer temperatures, snow cover, and equipment downtime. PVWatts is an informed estimate, not a promise.
During site reviews, I prefer a conservative design that remains useful on hazy winter days. I check whether modeled output aligns with real bills and production assumptions. If two estimates differ widely, I investigate the inputs instead of choosing the larger number. My first calculation was too optimistic because I ignored late-afternoon shading. That mistake was small on paper, but visible in winter bills. Weather changes. Recheck the model when roof conditions, appliances, or local utility rules change.
For a 2026 solar electricity system, battery selection may matter more than headline panel efficiency. A battery should match daily loads, not an imagined emergency lifestyle. Measure evening consumption from recent utility bills. Include refrigeration, heating, pumps, and home-office equipment. Nameplate capacity can mislead. Usable capacity is the figure that powers appliances after operating limits.
Cycle ratings deserve careful comparison. A battery rated for 4,000 cycles supports roughly one full cycle daily for ten years. A 6,000-cycle rating offers more practical headroom. However, cycle life depends on discharge depth, temperature, charging speed, and maintenance settings. Ask whether the warranty measures full cycles, partial cycles, or total energy throughput. Those terms are not interchangeable. A common planning mistake is sizing storage for rare outages while ignoring regular evening use.
A ten-year warranty should state the remaining capacity clearly, such as 70% after the coverage period. Check whether it covers labor, transport, replacement, and software-controlled performance limits. Some warranties exclude unusually hot or cold installation locations. Indoor placement may reduce thermal stress, but it can consume valuable utility space. Independent certification, documented testing, and an installer’s written load calculation strengthen buyer confidence. Still, predictions remain imperfect. Household usage changes, and battery performance can decline faster than a sales estimate suggests. Leave room for that uncertainty when comparing price and storage.
| Battery Chemistry | Typical Residential Capacity | Recommended Usable Capacity | Typical Cycle Life | Recommended Depth of Discharge | Round-Trip Efficiency | 10-Year Warranty Availability | Best Fit for Buyers |
|---|---|---|---|---|---|---|---|
| Lithium Iron Phosphate (LFP) | 5–30 kWh per system | 80–95% of rated capacity | 4,000–8,000 cycles | 80–95% | 88–96% | Common; often includes a time limit and a minimum retained capacity | Daily cycling, backup power, high safety, and long service life |
| Nickel Manganese Cobalt (NMC) | 5–25 kWh per system | 80–90% of rated capacity | 2,000–5,000 cycles | 80–90% | 90–97% | Available; warranty terms may restrict cycles, throughput, or operating conditions | Space-constrained installations needing high energy density |
| Sealed Lead-Acid (AGM or Gel) | 2–20 kWh per system | 40–50% of rated capacity | 500–1,500 cycles | 40–50% | 70–85% | Uncommon; shorter coverage periods are more typical | Low initial cost, occasional backup, and low-cycle applications |
| Vanadium Redox Flow | 10–100+ kWh per system | 70–100% of rated capacity | 10,000–20,000+ cycles | 70–100% | 65–85% | Possible; confirm the coverage period, stack warranty, and auxiliary-equipment terms | Large properties, frequent cycling, and long-duration storage |
The figures above are representative 2026 residential and small-commercial market ranges for comparing battery technologies. Actual performance depends on system design, temperature, charging strategy, operating depth, maintenance, and warranty conditions. Buyers should verify the current technical datasheet and warranty document before purchase.
For 2026 buyers, the best solar electricity system is not automatically the cheapest one. Cost depends on roof space, electricity tariffs, shading, and export rules. Lazard’s Levelized Cost of Energy+ Version 17.0 reports unsubsidized utility-scale solar at about $29–$92 per megawatt-hour. Residential rooftop solar is much higher, at roughly $117–$282 per megawatt-hour. These figures are useful benchmarks, but they are not household bill savings.
Incentives can change the decision quickly. Eligible United States projects have historically received a 30% federal clean-energy tax credit, subject to current IRS rules and installation requirements. Local rebates may reduce the upfront invoice further. A $20,000 system could cost $14,000 after a 30% credit. If it saves $1,400 annually, the simple payback is ten years. That calculation ignores financing, maintenance, battery replacement, degradation, and changing utility rates.
A spreadsheet is not the roof.
The International Energy Agency continues to identify solar power as a major source of new global electricity capacity. However, buyers should compare production estimates with hourly consumption, not annual totals alone. NREL’s PVWatts tool can model location, tilt, and shading, yet results remain estimates. I would challenge my first payback figure after checking winter output and future tariff changes. Batteries may improve resilience, but Lazard’s solar LCOE figures do not fully represent their added cost. A sensible purchase uses verified site measurements, conservative savings assumptions, and written incentive confirmation.